| Introduction
As modern IT applications scale rapidly, managing and analyzing server and application logs has become increasingly challenging. IT teams are often overwhelmed by infrastructure sprawl and the volume, velocity and variety of logs. The need for real-time automated insights into IT logs has never been more critical.
Many organizations experience severe disruptions due to hardware failures and scaling limitations in their network infrastructure. When systems scale without a cohesive monitoring strategy, IT teams often struggle to detect and resolve issues before they escalate. For example, three years ago a leading CSP experienced a major outage due to a hardware failure in a network device within one major region. This single point of failure cascaded into widespread service disruptions, affecting numerous high-profile websites and services such as leading streaming services, financial applications, communication platforms, and popular music services. The outage lasted several hours, resulting in significant reputation & revenue losses in addition to customer frustration across multiple industries.
Imagine an autonomous, resilient system where the infrastructure itself alerts IT teams to potential issues, allowing real-time insight into root cause and automatic resolution without the manual effort of sorting through countless logs. That’s where Metrum AI’s Gen AI IT Log Analyzer steps in—empowering IT teams to interact directly with infrastructure, diagnose problems faster, and streamline the entire process through an AI-powered solution.
In this blog, we explore how Metrum AI’s Retrieval-Augmented Generation (RAG) solution, hosted on Dell PowerEdge™ XE9680 servers equipped with Nvidia H200 Data Center Tensor Core GPUs, transforms log analysis and infrastructure management.
The hardware selection criteria for this solution focus on high performance and memory capacity to handle complex log analysis and infrastructure management tasks. These criteria are crucial because they directly impact the system’s ability to process large volumes of log data in real-time and run multiple instances of advanced large language models simultaneously.
| Hardware Selection
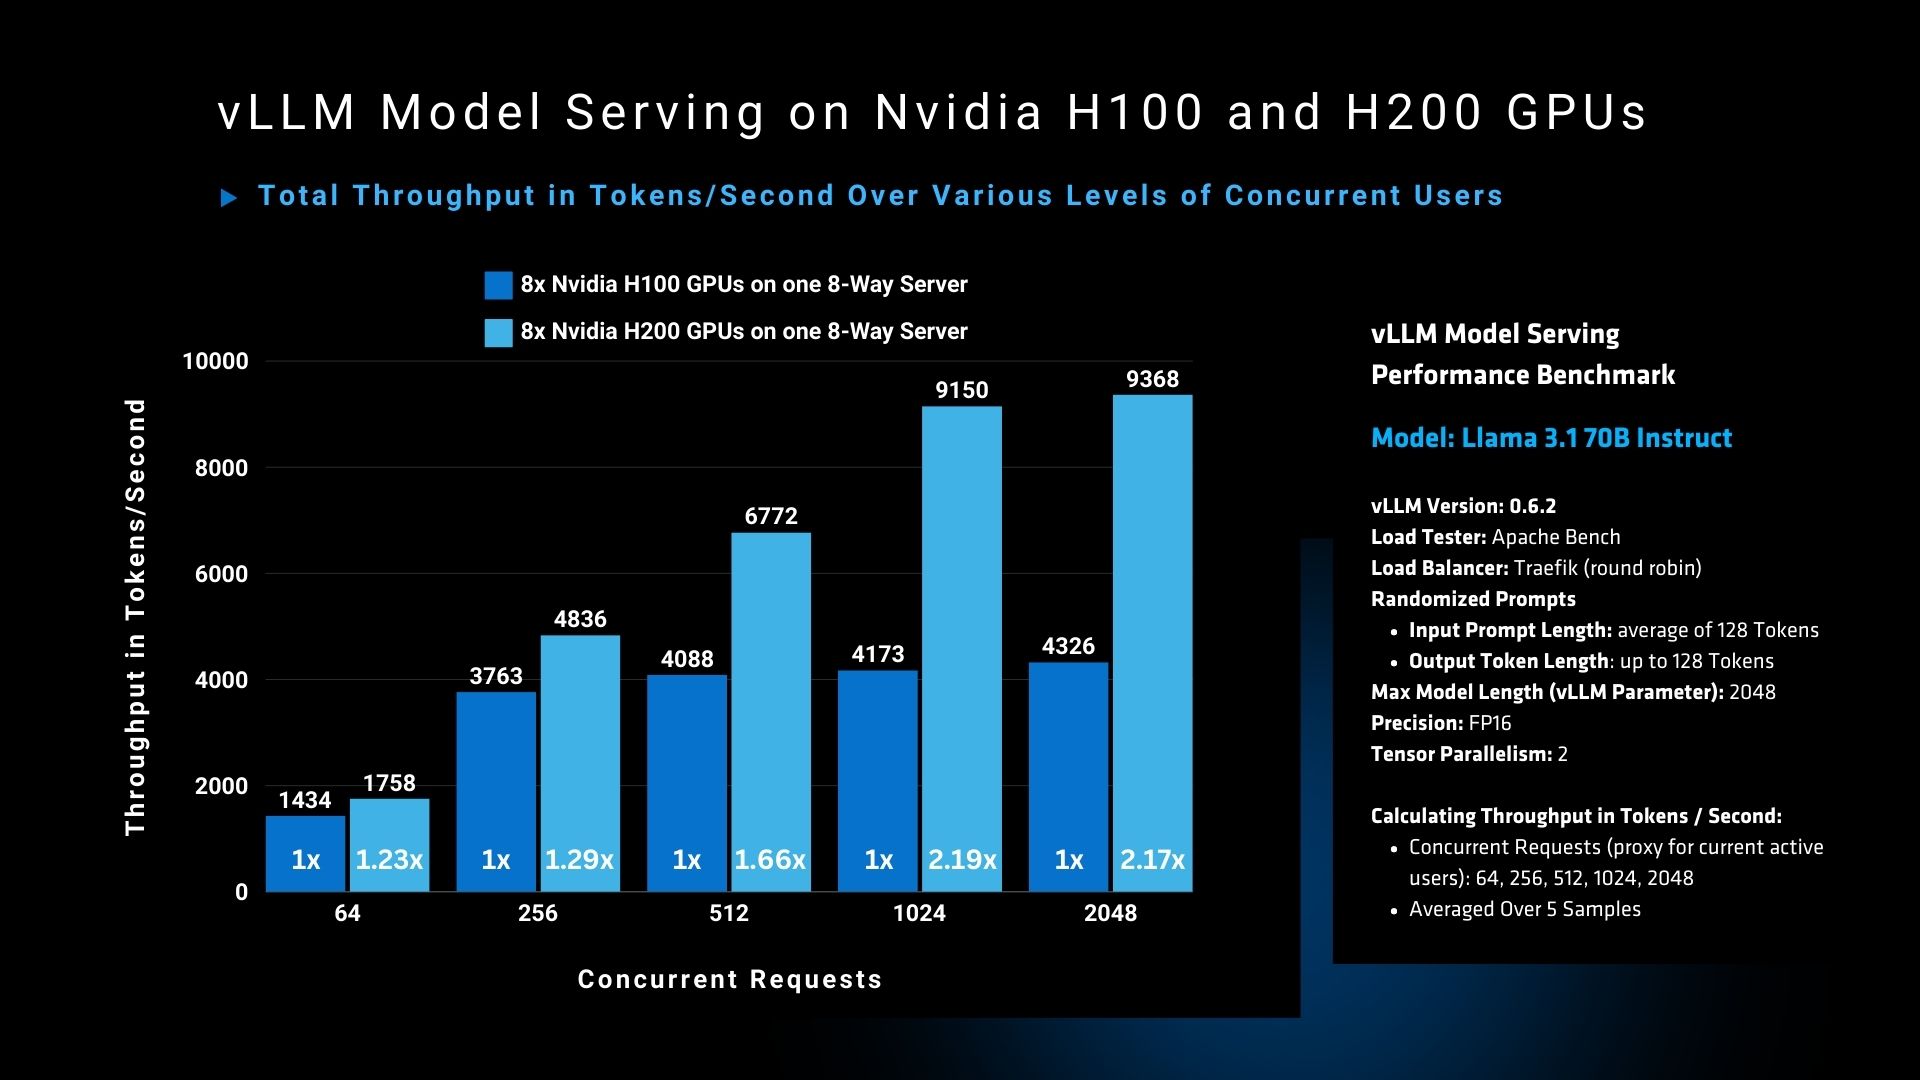
The graph demonstrates a clear performance advantage of the Nvidia H200 GPU over the H100 GPU in handling high concurrency workloads, particularly as the number of concurrent users increases. At the highest level of 2048 concurrent users, the H200 GPU achieves a throughput of 9368 tokens per second, compared to 4326 tokens per second for the H100, marking a >2x improvement. This significant difference underscores the H200’s enhanced capability in high-demand environments.
We selected the Dell PowerEdge XE9680 equipped with NVIDIA H200 GPUs for our solution due to its exceptional performance and memory capacity, which is crucial for handling the latest high parameter count large language models. With 141GB of HBM3e memory per GPU, representing a significant 60% increase from the H100’s 80GB, we can efficiently run and serve multiple instances of leading large language models. Memory and compute-intensive workloads, such as concurrent model serving and real-time content generation, are streamlined using a single hardware system with eight H200 GPUs. The server’s support for Broadcom ethernet network adapters ensures high-speed data transfer and efficient network connectivity for distributed workloads. Performance testing demonstrates that the H200 delivers a throughput increase ranging from 1.2x at lower concurrency levels to more than 2x compared to the H100 at high concurrency scenarios, particularly as the number of concurrent requests rises. Concurrent requests are used as a proxy for concurrent users, which transition into daily active users in real world scenarios. This performance improvement is achievable due to the enhanced memory capacity and next-generation Transformer Engine in the H200 GPU, combined with the robust architecture of the Dell PowerEdge XE9680 server.
To power our IT log analyzer, we integrated essential components such as text generation models, embedding models, and a vector database. The expanded memory and superior computational performance of the H200, combined with the robust Dell PowerEdge XE9680 architecture, enable seamless processing of large data sets, ensuring that log analysis remains fast, accurate, and efficient. This allows IT teams to diagnose and resolve issues quickly without bottlenecks or delays.
| Solution Architecture
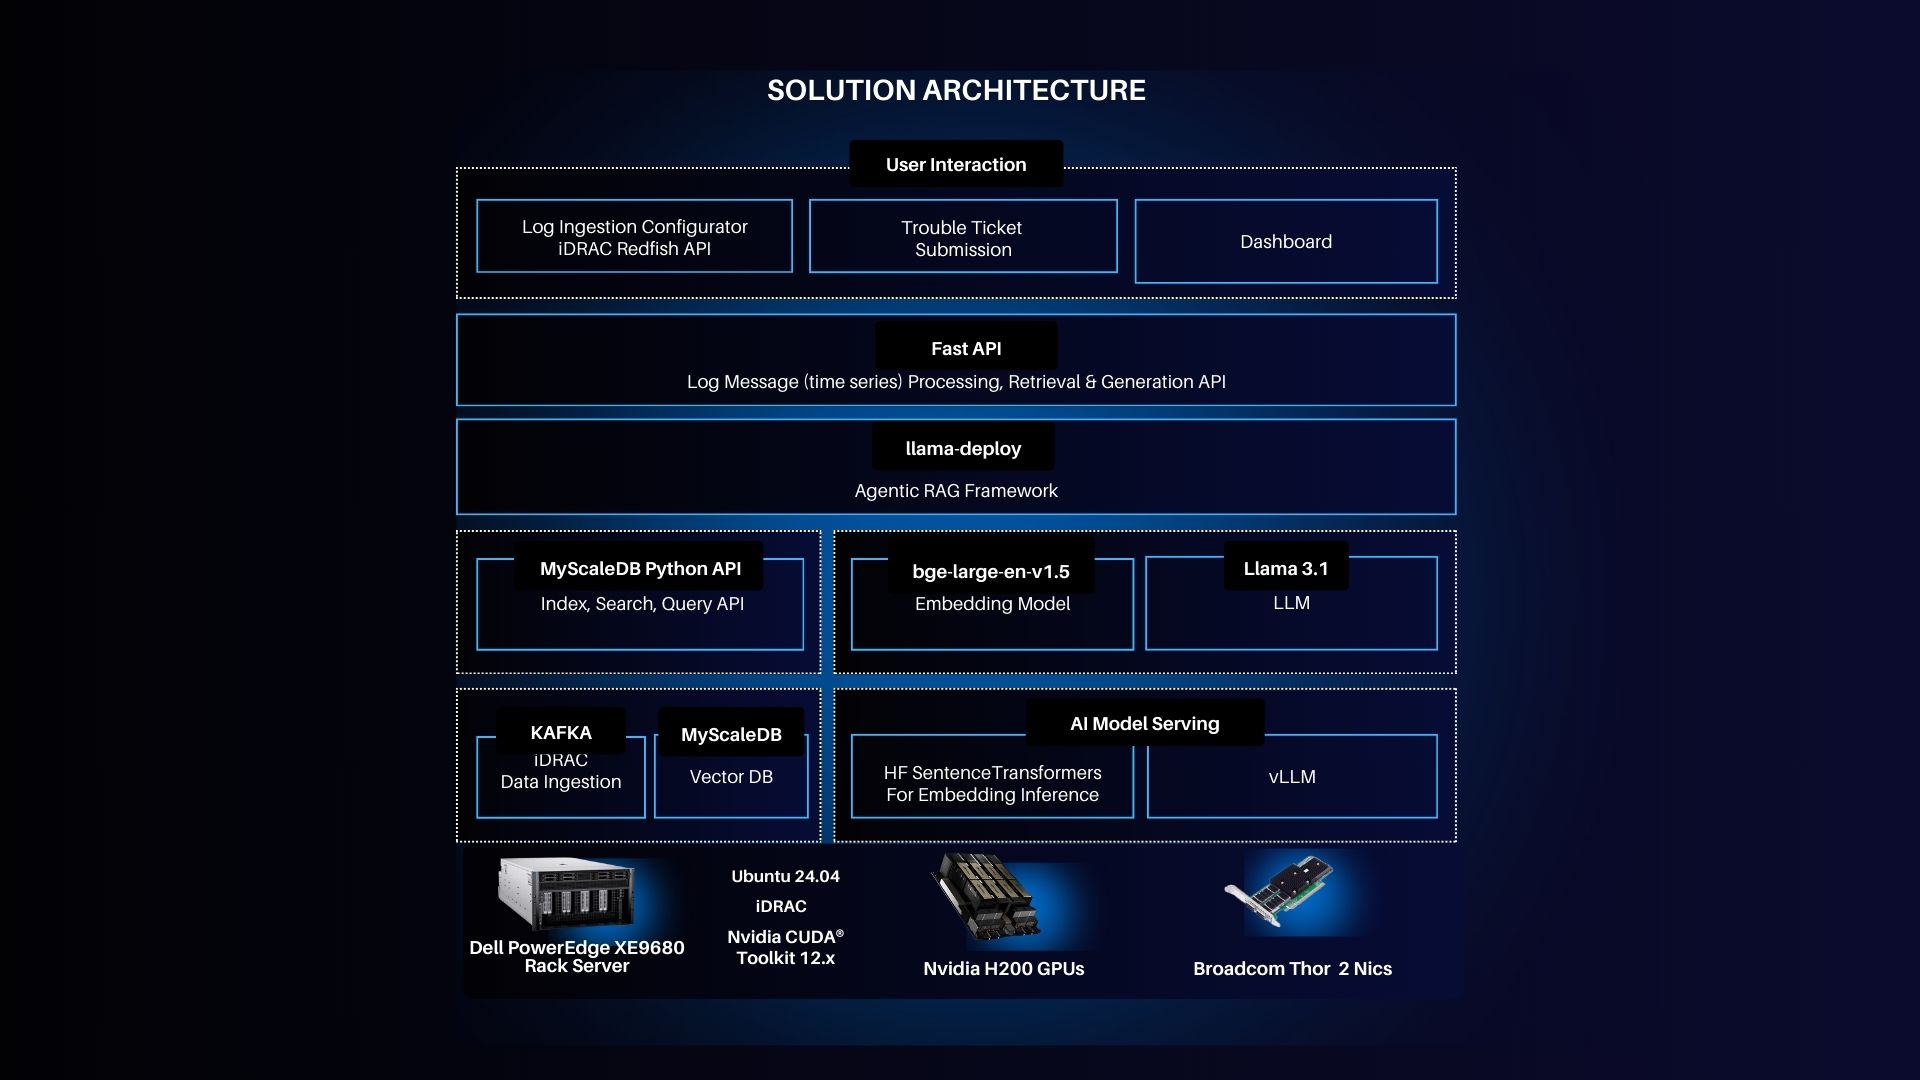
- Server: Dell PowerEdge™ XE9680, running Ubuntu 24.04 LTS, features NVIDIA H200 GPUs and Broadcom networking adapters, optimized for AI workloads. This setup ensures that even the heaviest log data can be processed in real time with high network throughput.
- iDRAC Integration: Dell’s Integrated Remote Access Controller (iDRAC) allows IT teams to monitor server health, handle updates, and track system status without physical access. For our solution, iDRAC logs play a critical role in diagnosing hardware issues.
- Log Analyzer 2.0 Control Plane: This forms the heart of the solution, where logs are ingested, processed, and troubleshooted. Utilizing APIs like FastAPI, the control plane integrates with containerized applications, allowing users to interact with logs and submit trouble tickets directly from a sleek dashboard.
- Agentic RAG Framework: Powered by the Llama 3.1 language model, this AI-driven framework retrieves and processes logs in real-time, providing IT teams with instant insights.
- Data Ingestion and Vector DB: A scalable architecture backed by Kafka for data ingestion and MyScaleDB, chosen over other Vector DB alternatives for its unique ability to handle complex, multi-dimensional search queries efficiently, particularly in AI-powered environments.
Now that we’ve covered the core hardware and software stack of the solution, let’s shift focus to the crucial components that manage the flow of data: iDRAC and the Exporter. These elements ensure that logs are consistently monitored, managed, and transferred from the server to the log analyzer, playing a key role in the system’s overall performance and reliability.
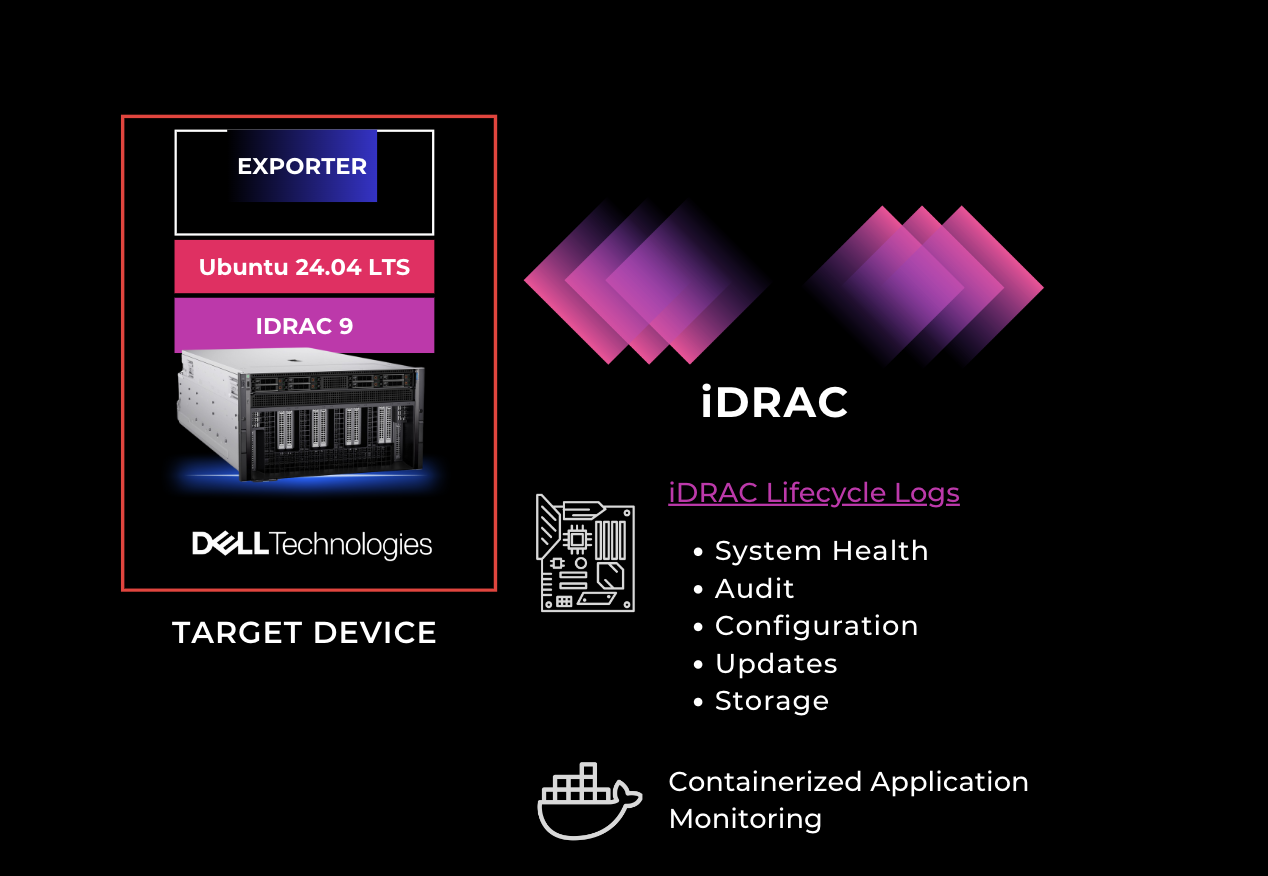
- Exporter: The exporter is responsible for transferring data from the server, allowing logs and system information to be exported from the server for analysis. It plays a crucial role in ensuring that data flows smoothly from the target device to the log analyzer.
- iDRAC Lifecycle Logs: The lifecycle logs displayed in the image track various aspects of the system, such as system health, audits, configurations, updates, and storage. These logs are crucial for monitoring and managing the server’s lifecycle.
- Containerized Application Monitoring: This indicates the capability to monitor applications that run in containers, allowing IT teams to ensure that not only the server but also the applications hosted on it are functioning properly.
| Key Features
- iDRAC Lifecycle Logs: Integrated iDRAC support enables seamless monitoring of system health and hardware events, providing insights into power, memory, GPU status, and more.
- Log Ingestion Interface: The solution offers customizable ingestion, supporting server, network, and application logs across various sources.
- AI-powered Error Correlation: Through sophisticated AI models, the solution correlates errors across multiple log sources, enabling early detection and diagnosis.
- Automated Ticket Generation: Following log analysis, the system generates incident tickets in a standard PDF format, ensuring IT teams have a clear, actionable path forward.
- Scalable AI Insights: With its support for multi-source log ingestion and analysis, the system can scale effortlessly to handle large enterprise environments.
| Why We Chose MyScaleDB as Our Vector DB
In selecting the best vector database for our log analyzer, we considered multiple options like Milvus and Postgres with pgvector. MyScaleDB stood out due to its robust capabilities in handling high-dimensional vector searches, essential for real-time log analysis and retrieval in our system.
- Efficiency: MyScaleDB provides low-latency search and retrieval, even with time-based indexing and large-scale log ingestion, ensuring real-time performance.
- Seamless AI Integration: Unlike other databases, MyScaleDB integrates seamlessly with our RAG framework’s embedding models, such as Llama 3.1, enhancing AI-driven insights.
- Scalability: MyScaleDB maintains high performance as log volumes increase, making it a reliable choice for continuous log ingestion and real-time analysis.
While MilvusDB excels in managing unstructured data and vector searches, it lacks strong support for time-based indexing and querying. This makes it less effective for precise log retrieval based on timestamps, a critical feature for real-time analysis in our system. MyScaleDB’s ability to handle structured data alongside vectors gives it a distinct advantage in this use case. It also significantly reduces the time between log ingestion and delivering actionable insights.
| Key Features of the Autonomous IT Log Analyzer Agent
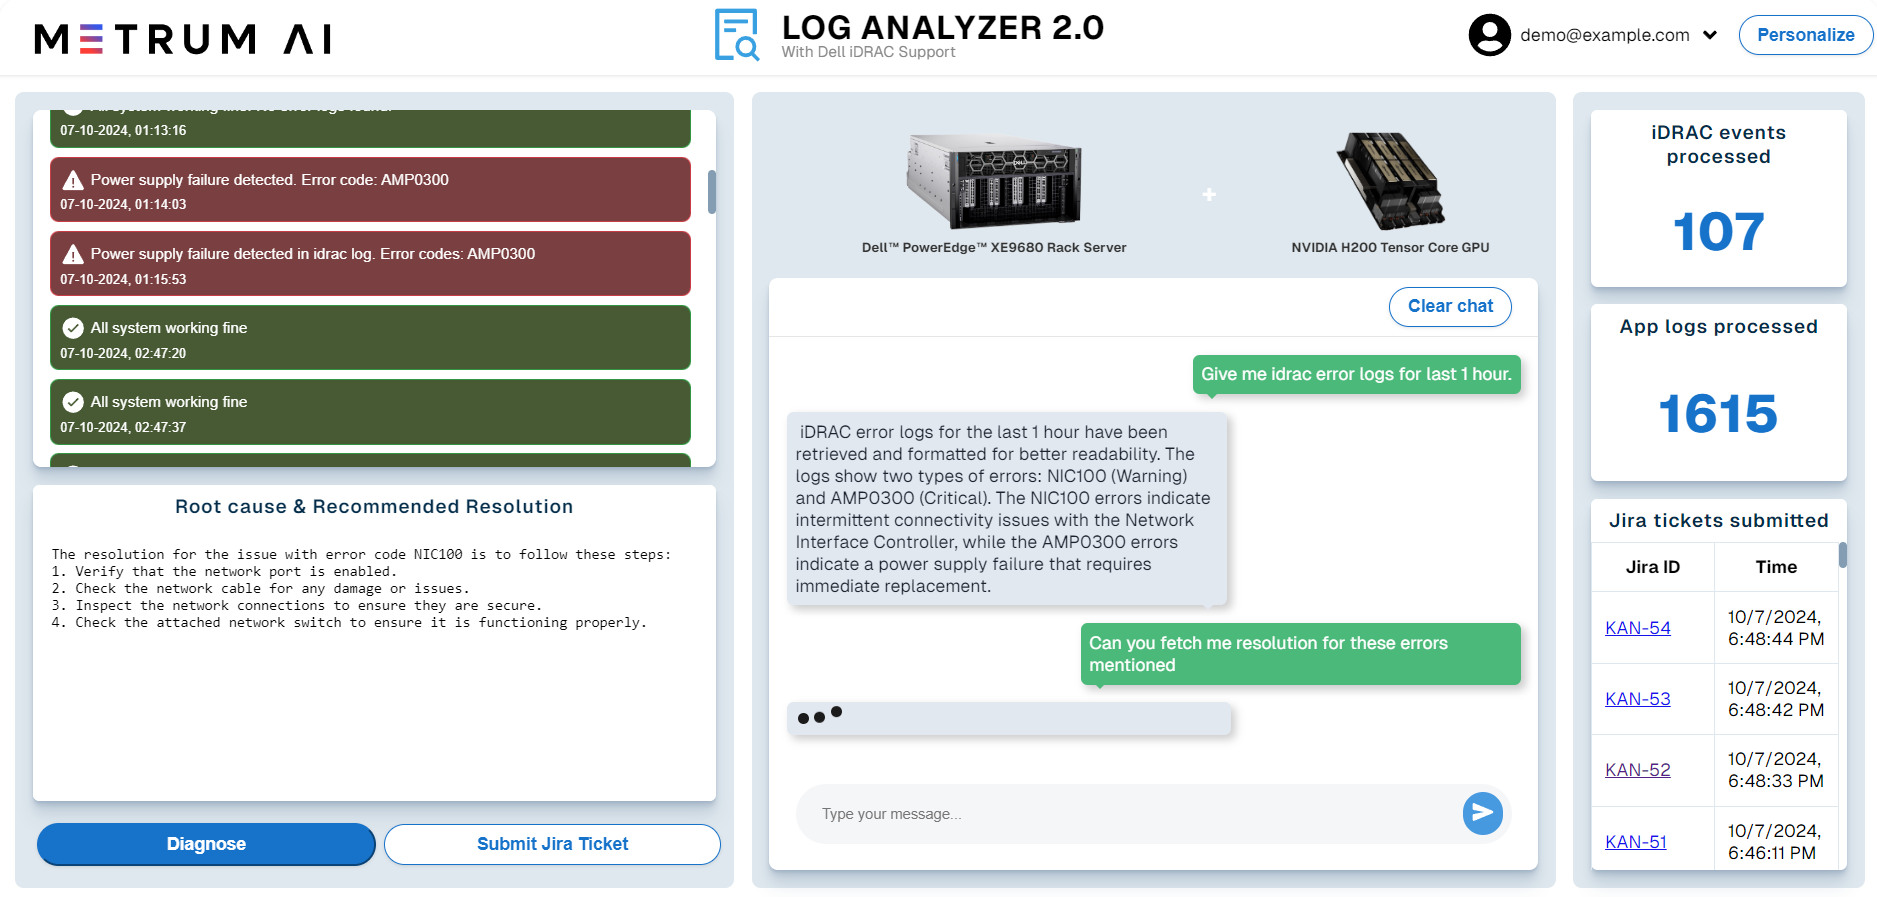
- Log Ingestion: Users can easily ingest logs from servers, applications, and networks through an intuitive interface.
- Time Frame Selection: IT teams can specify the time range for targeted log analysis.
- AI-Powered Insights: The system analyzes the logs and automatically identifies errors, highlighting critical issues and referencing the relevant logs.
- Correlated Error Analysis: AI correlates errors across multiple log sources, providing a comprehensive view of potential problems.
- Jira Ticket Submission: Once an error is diagnosed, the system automatically generates a Jira ticket with detailed diagnostic information, ensuring quick action by IT teams.
- Root Cause & Resolution: The system offers suggested solutions and guides teams through resolving issues based on past incidents and knowledge banks.
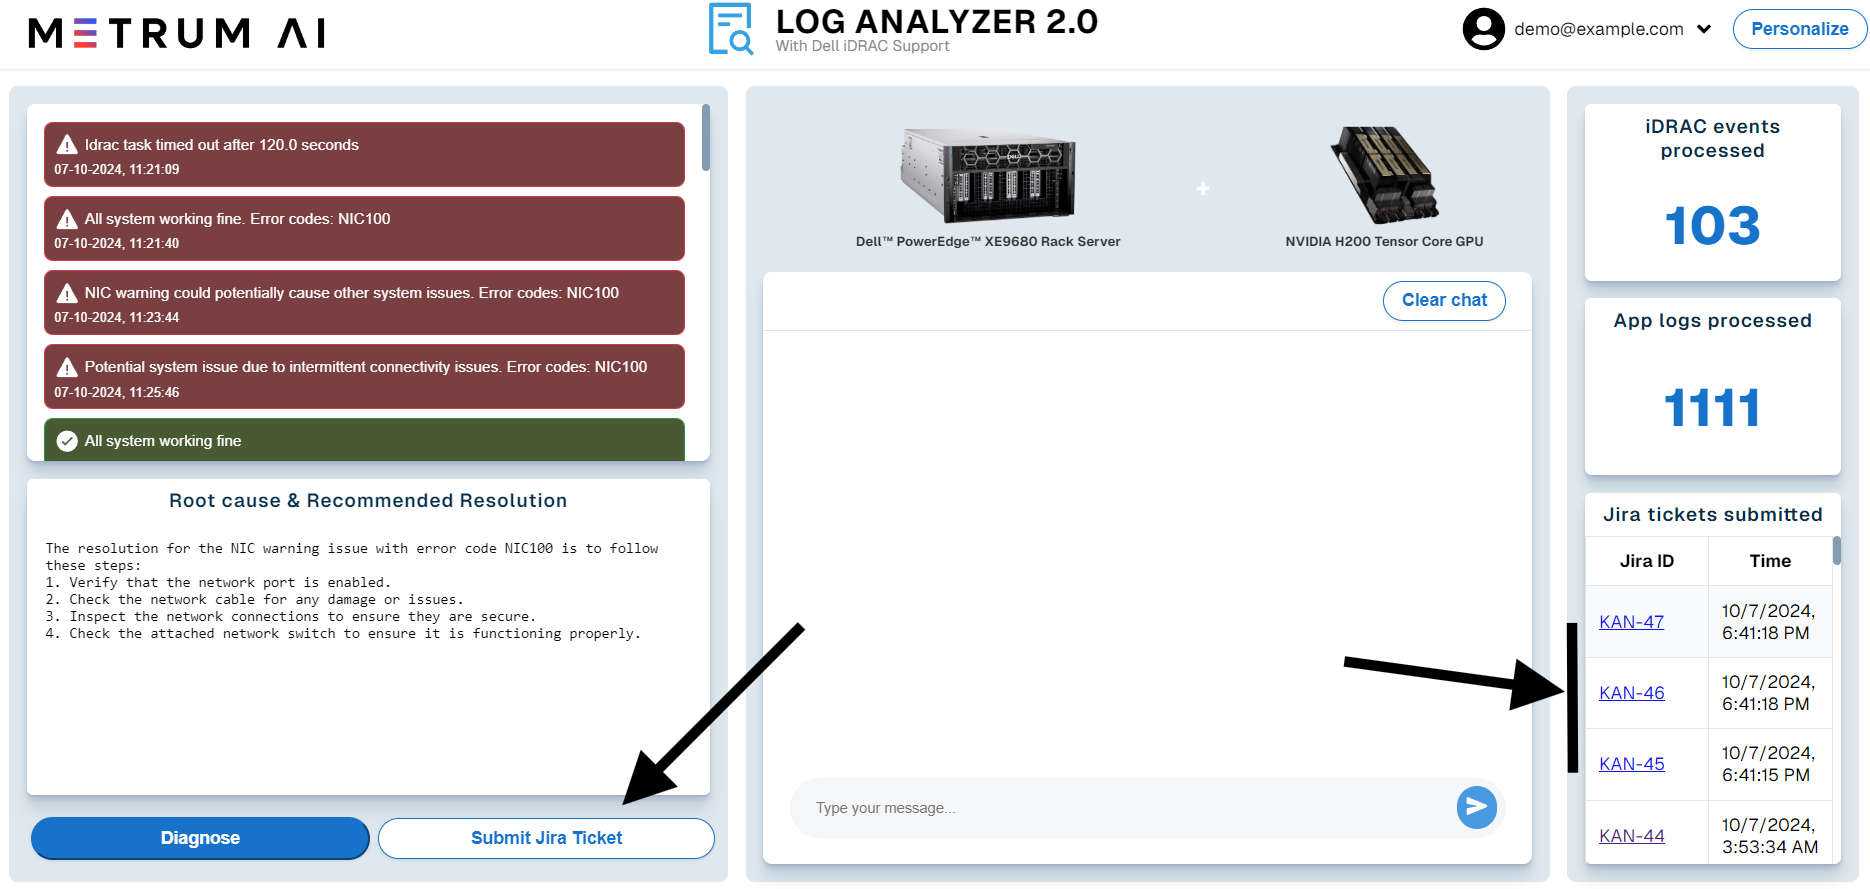
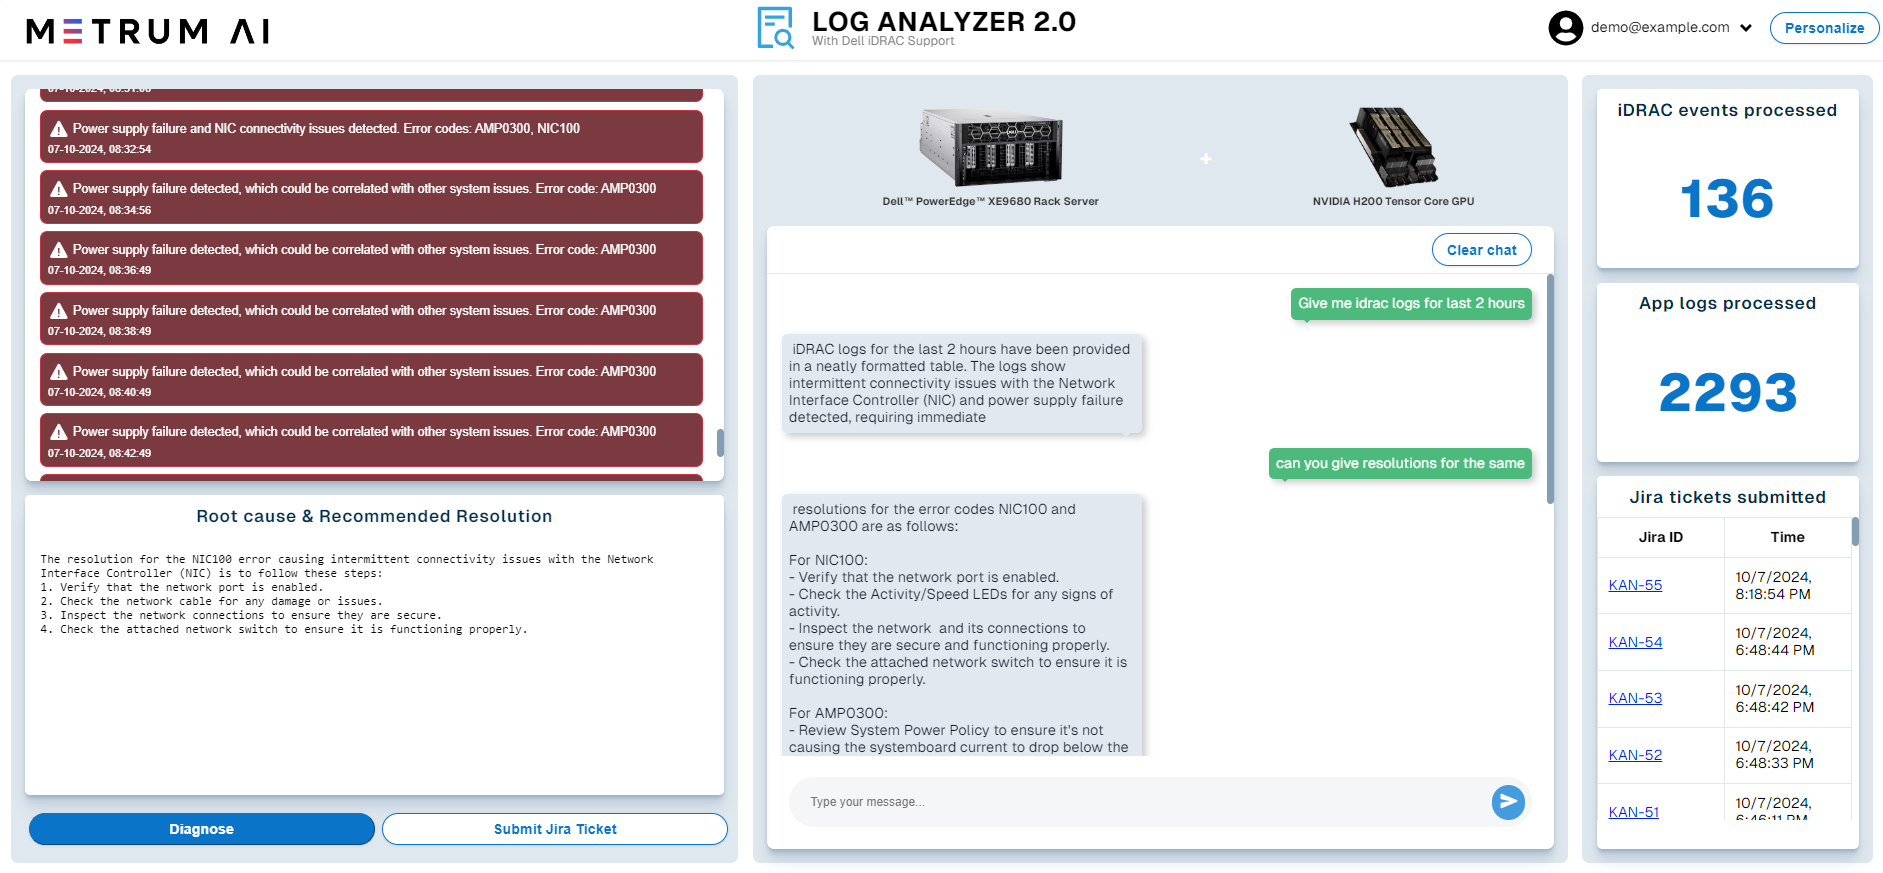
- Real-Time Monitoring and Reporting: The image shows metrics like iDRAC events, logs processed, and tickets submitted, giving teams a clear view of system health and responsiveness.
- Diagnostic and Troubleshooting Features: A “Diagnose” button enhances the interactive nature of the platform, allowing IT staff to trigger diagnostics instantly.
| Solution Walkthrough
The following solution walkthrough with example scenarios demonstrates how the Gen AI IT Log Analyzer responds to real-time log analysis requests. These examples show how the system processes user queries, generates insights, and submits Jira tickets for further resolution.
The following are examples of user queries with the corresponding responses and resolution suggestions.
- Can you provide IDRAC logs for last 30 minutes?
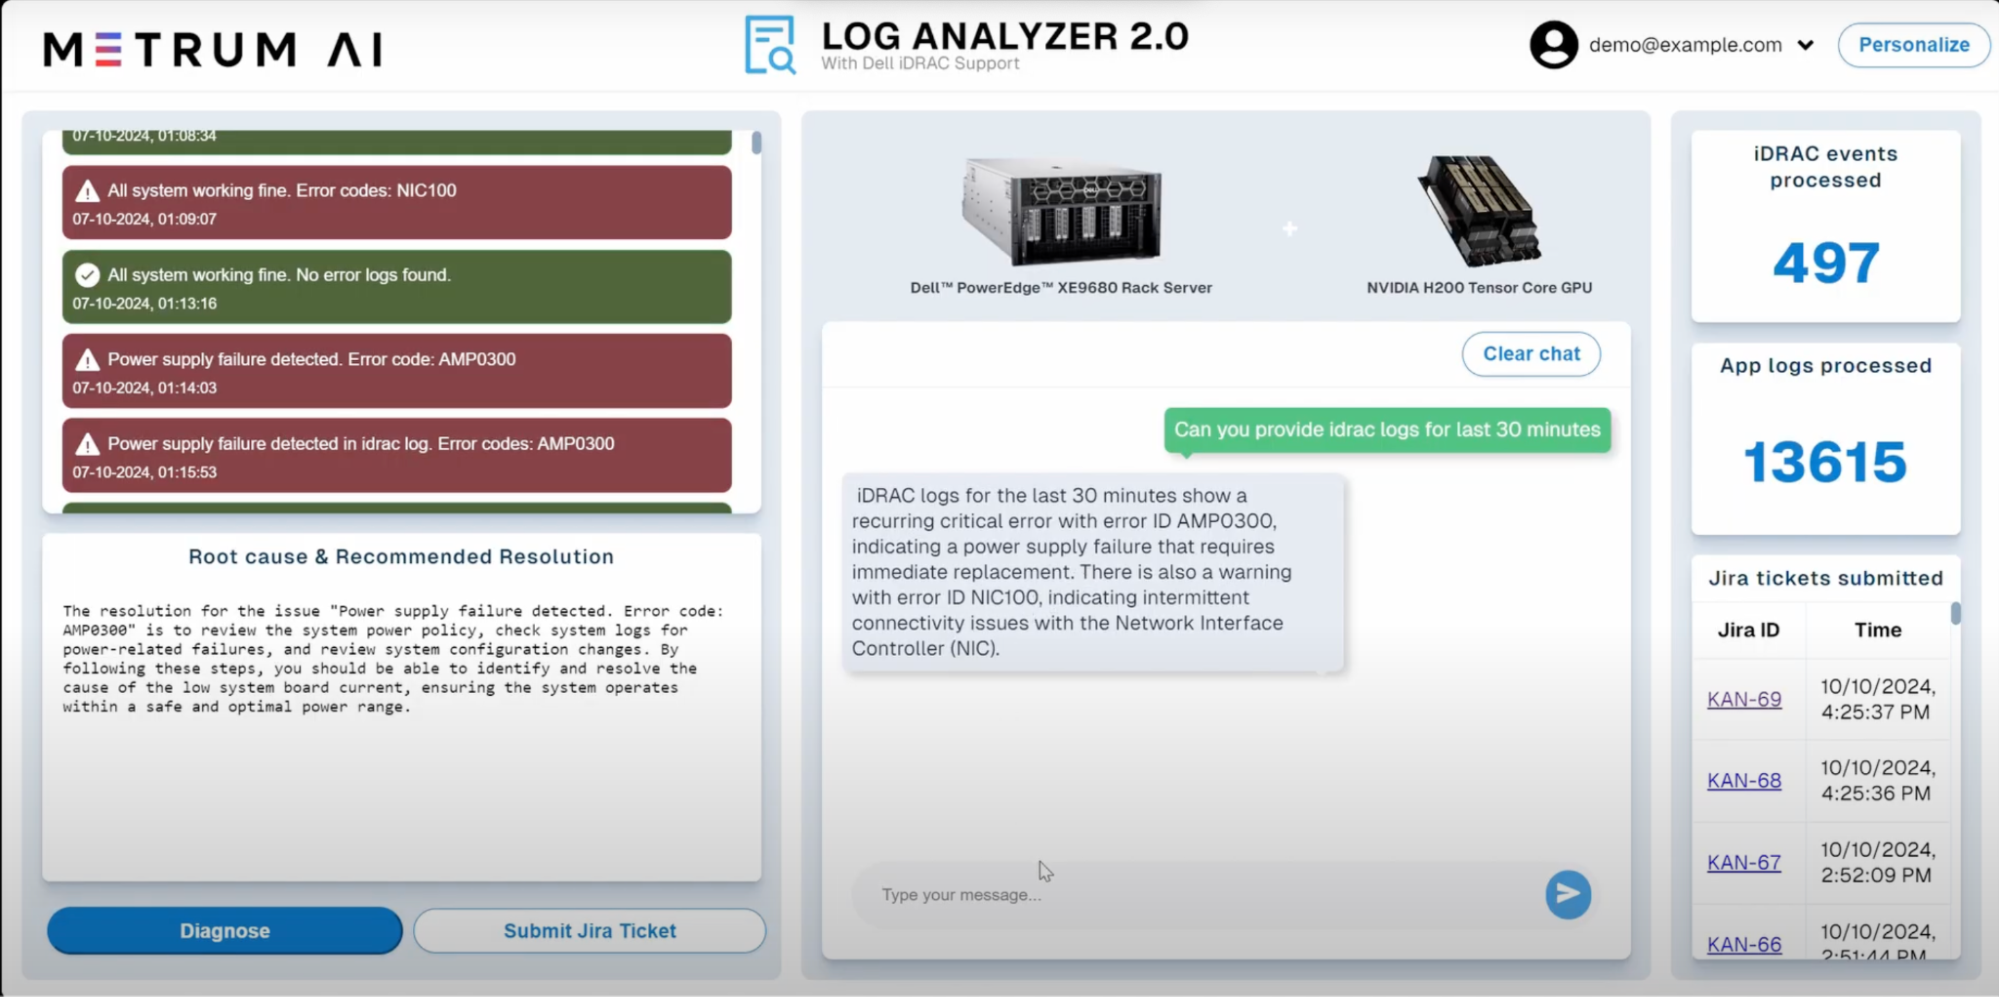
The figure above depicts a closer view of the generated error logs. When you click on any error log entry, the application will display the corresponding resolution suggestion at the bottom of the screen. This feature enables users to quickly identify and address errors without having to navigate through multiple screens or applications.
- Can you provide the resolution for NIC100?
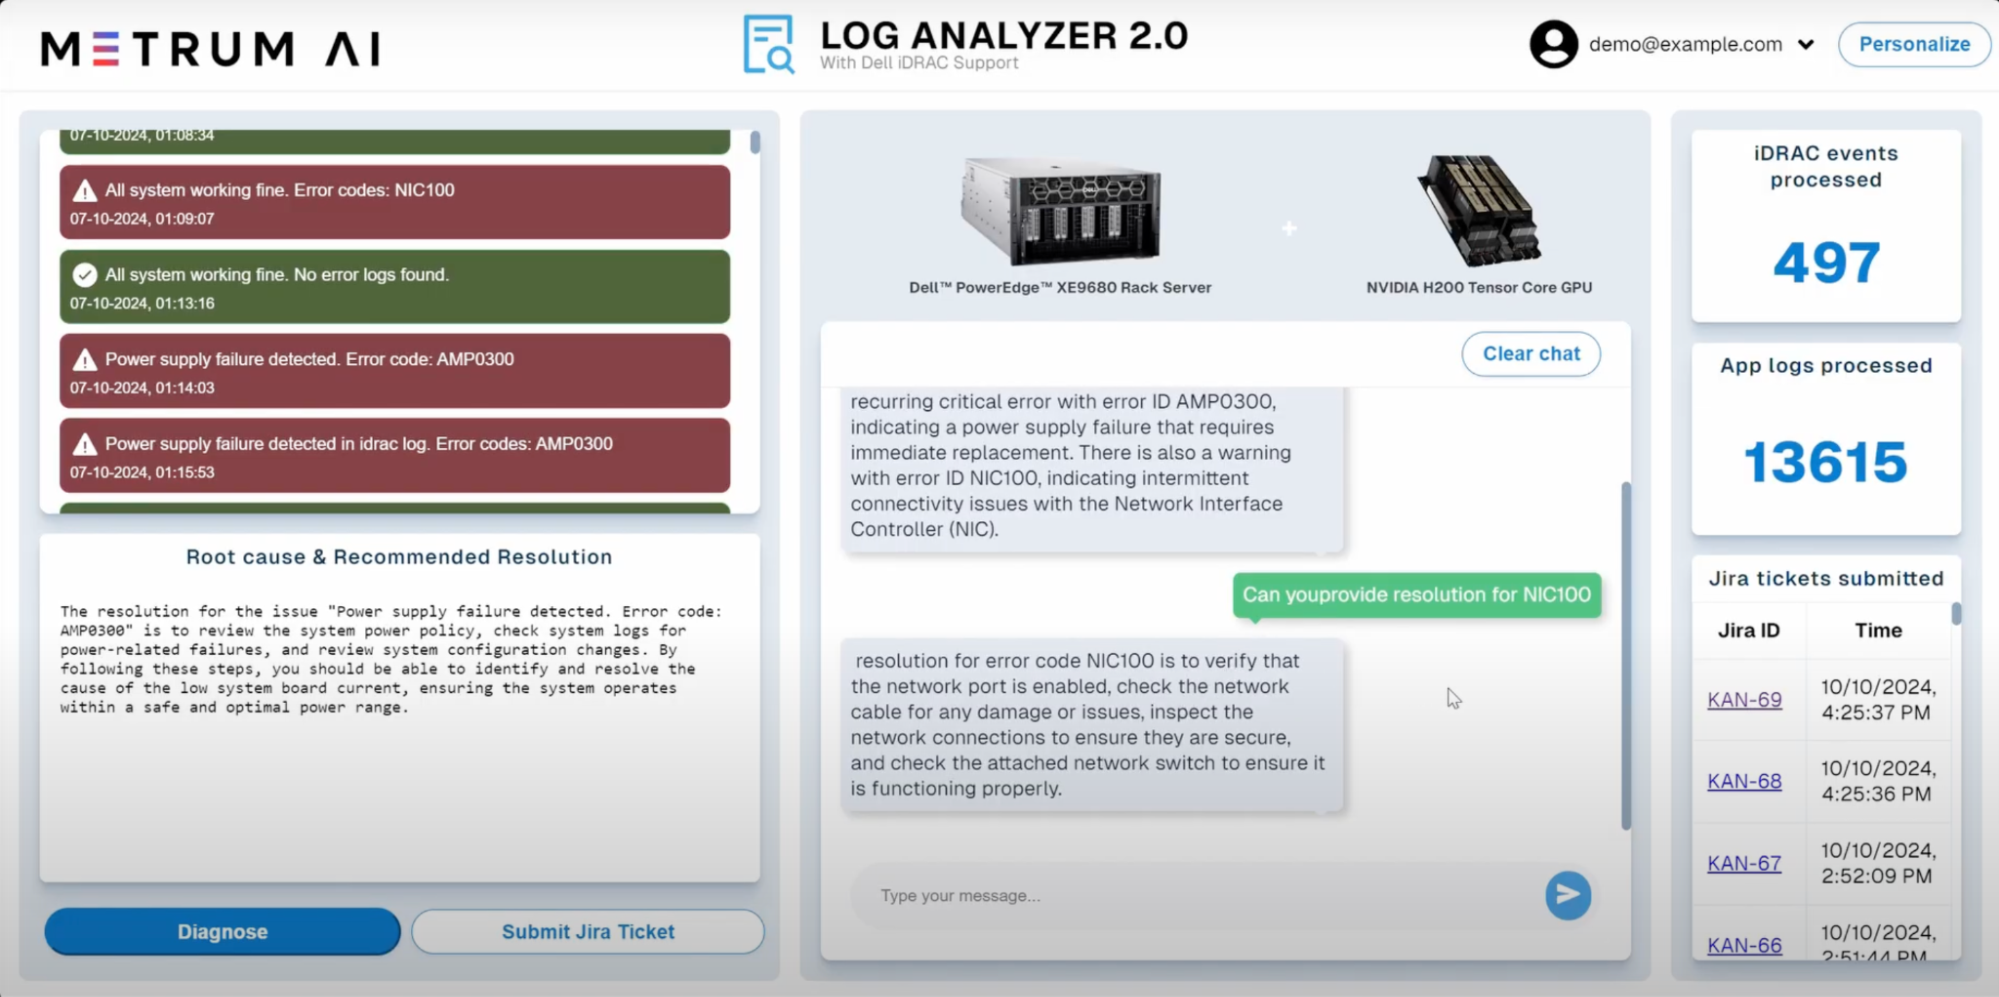
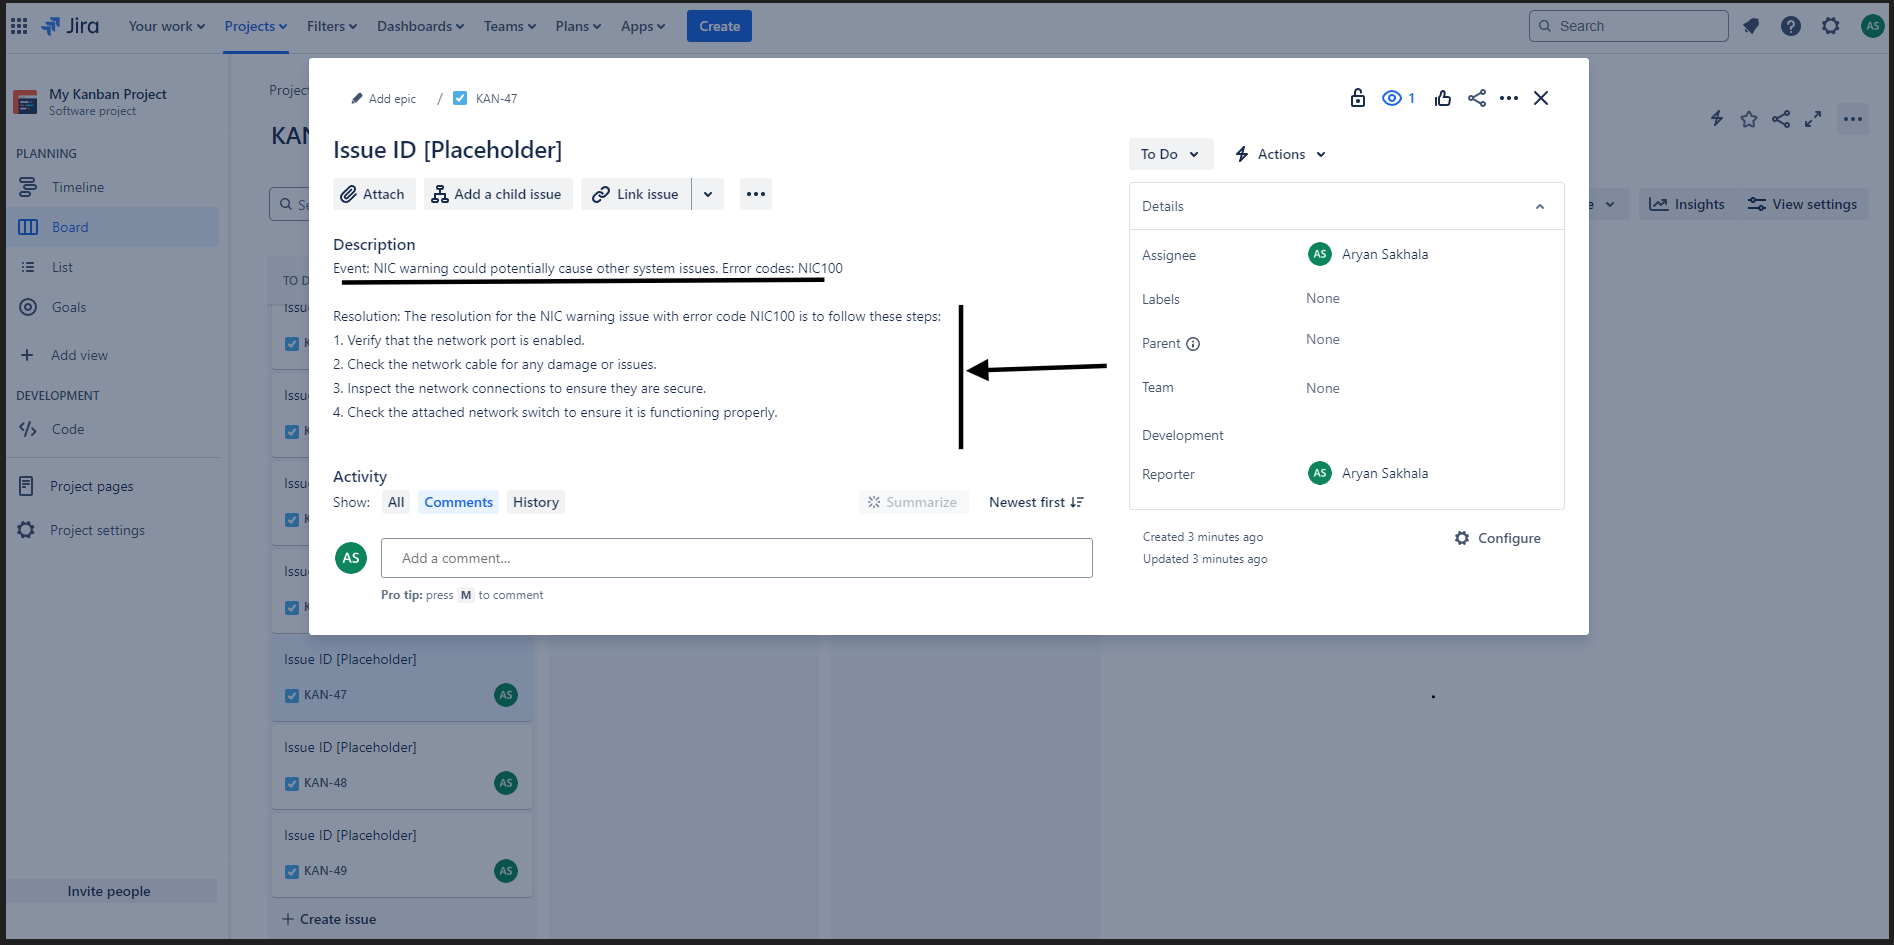
After reviewing the resolution suggestion, users can create a Jira ticket directly from the application by clicking the Submit Jira Ticket button. This streamlined process ensures that issues are documented and tracked efficiently, reducing the time spent on manual ticket creation.
Upon submitting the Jira ticket, the application will display the Jira issue ID in the bottom-right panel. Users can click on this issue ID to directly access the Jira issue, ensuring easy tracking and management of the issue throughout its lifecycle.
The application will also provide a detailed diagnosis of the issue, by providing logs. As soon as the Diagnose button is clicked, Docker logs and iDRAC logs around the time of the error are displayed.
The application then provides a chat interface to chat with the logs.
As shown in this solution walkthrough, the IT Log Analyzer solution demonstrates robust capabilities for real-time log analysis and incident management. It efficiently retrieves specific iDRAC logs upon request, provides resolutions for detected issues like power supply failures or network interface controller errors, and seamlessly integrates with Jira to automatically create tickets with detailed diagnostics. These features ensure that IT teams can quickly access relevant data, receive actionable insights, and streamline the troubleshooting process, leading to faster resolution times and improved system reliability.
| Conclusion
In the IT industry, managing large volumes of log data from multiple sources is a complex and time-consuming task. IT teams often struggle with identifying critical errors quickly, searching through logs manually, and addressing issues before they lead to significant downtime. These inefficiencies not only impact operational performance but also delay the focus on innovation and strategic initiatives. The need for a more efficient, automated solution is clear.
Problem | Solution |
---|---|
Managing log data from multiple sources | Streamlined log analysis that automates and accelerates data processing. |
Slow time in identifying critical errors | Faster root cause analysis with AI-driven insights, minimizing downtime. |
Manual log retrieval and search processes | Efficient search capabilities using MyScaleDB for rapid vector-based searches. |
Delayed issue resolution due to human error | Automated ticketing through Jira with detailed diagnostics for swift action. |
Metrum AI’s Gen AI IT Log Analyzer, powered by Nvidia H200 Tensor Core GPUs and Dell PowerEdge XE9680, directly addresses these challenges with AI-driven automation. By streamlining log analysis, accelerating root cause identification, and automating ticketing processes, this solution significantly reduces downtime, enhances operational efficiency, and allows IT teams to shift their focus from reactive troubleshooting to proactive innovation. In a landscape where every second of uptime counts, this AI solution is a game-changer for IT operations.
To learn more, please request access to our reference code by contacting us at contact@metrum.ai.
| Addendum
| Performance Testing Methodology
Our performance benchmarking architecture, as shown in the diagram above, consists of four key components: Apache Bench for load testing, a Prompt Randomizer for generating diverse inputs, Traefik as a load balancer, and multiple vLLM Serving Replicas. vLLM (Virtual Large Language Model) is an open-source library designed to optimize the deployment (inference and serving) of large language models (LLMs), which addresses the challenges of high computational demands and inefficient memory management typically associated with deploying LLMs in real-world, client-server applications. To achieve this, vLLM implements a number of optimizations including dynamic batching. Here, we use vLLM 0.6.2 to reflect the common approach enterprises take to deploy AI.
Traefik serves as our load balancer, efficiently distributing input requests from Apache Bench across the multiple vLLM serving replicas. Each replica is configured to load the model with specified tensor parallelism. The Apache Bench, working through the prompt randomizer, accesses Traefik at port 9080, which then distributes requests among the vLLM replicas using a round-robin strategy.
We deployed Llama-3.1-70B-Instruct using vLLM 0.6.2 with FP16 precision, and conducted performance testing by varying the number of concurrent requests using Apache Bench with the following values: 1, 2, 4, 8, 16 … 4096, 8192. We also employed a prompt randomizer component which substitutes a random prompt from a pool of “k” prompts, configurable to millions of randomized prompts from a given pool, to simulate real-world concurrent user activity.
Our testing parameters are also carefully chosen to reflect real-world scenarios. We used an input prompt length of approximately 128 tokens, with a maximum of 128 new tokens generated and a maximum model length of 2048. We collected our final throughput metrics by taking an average over five samples and used eight vLLM servers with a tensor parallelism of 2.
To monitor performance, we employ a Metrics Collector module that gathers production metrics from each vLLM server’s /metrics endpoint. This comprehensive setup allows us to thoroughly evaluate the performance of H200 and H100 GPUs in handling LLM workloads, providing valuable insights for enterprise AI deployments.
| Hardware Configuration Details
| Additional Criteria for IT Decision Makers
| What is RAG, and why is it critical for enterprises?
Retrieval-Augmented Generation (RAG), is a method in natural language processing (NLP) that enhances the generation of responses or information by incorporating external knowledge retrieved from a large corpus or database. This approach combines the strengths of retrieval-based models and generative models to deliver more accurate, informative, and contextually relevant outputs.
The key advantage of RAG is its ability to dynamically leverage a large amount of external knowledge, allowing the model to generate responses that are informed not only based on its training data but also by up-to-date and detailed information from the retrieval phase. This makes RAG particularly valuable in applications where factual accuracy and comprehensive details are essential, such as in customer support, academic research, and other fields that require precise information.
Ultimately, RAG provides enterprises with a powerful tool for improving the accuracy, relevance, and efficiency of their information systems, leading to better customer service, cost savings, and competitive advantages.
| What are AI agents, and what is an agentic workflow?
AI agents are autonomous software tools designed to perceive their environment, make decisions, and take actions to achieve specific goals. They utilize artificial intelligence techniques, such as machine learning and natural language processing, to interact with their surroundings, process information, and perform tasks with varying degrees of independence and complexity.
An agentic workflow in AI refers to a sophisticated, iterative approach to task completion using multiple AI agents and advanced prompt engineering techniques. Unlike traditional single-prompt interactions, agentic workflows break complex tasks into smaller, manageable steps, allowing for continuous refinement and collaboration between specialized AI agents. These workflows leverage planning, self-reflection, and adaptive decision-making to achieve higher accuracy and efficiency in task execution. By employing multiple AI agents with distinct roles and capabilities, agentic workflows can handle complex problems more effectively, often producing results that are significantly more accurate than conventional methods. This approach represents a shift towards more autonomous, goal-oriented AI systems capable of tackling intricate challenges across various domains.
| What are some of the typical types of LLM context window scenarios and requirements for various RAG applications?
Scenario | Use Case Examples | Token Lengths | Dell 9680 8xH200 Advantages |
---|---|---|---|
Long Input Sequences | Summarizing lengthy reports, analyzing large datasets | 10,000 - 50,000 tokens | Efficiently processes high token counts without latency spikes |
Large Models | Complex content generation, intricate data analysis | 2,000 - 5,000 tokens per request | Supports large models with high precision |
Large Batch Sizes | Bulk data processing, large-scale content generation | 500 - 2,000 tokens per item in batch | High throughput for batch-oriented tasks |
Standard Inference | Short-form responses, chatbot replies | 100 - 500 tokens | Suitable for standard tasks but excels in high-token scenarios |
| References
Dell images: Dell.com
Copyright © 2024 Metrum AI, Inc. All Rights Reserved. This project was commissioned by Dell Technologies. Dell and other trademarks are trademarks of Dell Inc. or its subsidiaries. Nvidia and combinations thereof are trademarks of Nvidia. All other product names are the trademarks of their respective owners.
***DISCLAIMER - Performance varies by hardware and software configurations, including testing conditions, system settings, application complexity, the quantity of data, batch sizes, software versions, libraries used, and other factors. The results of performance testing provided are intended for informational purposes only and should not be considered as a guarantee of actual performance.